About us

Solutions
Products
Content


Por
At the end of 2025, we put together a retrospective of the year's most popular economic events and showed that expectations for 2026 were actually a bit more encouraging than they might seem. Like a well-curated playlist, the year delivered some positive surprises—the IPCA closed at 4.26%, the lowest mark in six years, still above the target but within the established range, defying the more pessimistic projections that had reached over 5.50% throughout the year, according to the Central Bank's Focus report. In other words, the curation of monetary policy seems to have worked: difficult tracks played, the listener endured the high volume of interest rates, and the album ended better than expected. Speaking of albums...
The turn of the year, however, changed format. If 2025 was a playlist with chosen, ordered songs with a nearly predictable beginning, middle, and end, 2026 arrived like an empty sticker album. You know which ones you want to collect, you make a plan, and you open the envelopes with high expectations, but reality deals whatever it wants: the first packs of the year came with Trump's tariffs, which reignited the risk of global trade fragmentation, pressured the dollar, and put emerging economies on the defensive—with more volatile exchange rates and higher risk premiums. Then came the escalation of the conflict in the Middle East, which pushed oil prices up, contaminating fuel, freight, and the entire supply chain in a transmission mechanism that is rapid and difficult for domestic monetary policy to control. Two external shocks of different natures that arrived at a time when the anchoring of expectations still required care. A duplicate sticker, an envelope empty of good surprises, and the shiny sticker—the one with the 3.0% inflation target stamped on it—that everyone is looking for but almost no one can find, seems to be getting further and further away from the latest inflation data in Brazil. (see chart)

Opening the envelopes month by month. The album started full of promise. January and February came with some reasonable envelopes, without any major negative surprises. The cumulative total for the first quarter was 1.92%—a number that, looked at in isolation, doesn't seem alarming, but when compared to previous years, it raised a red flag. (see chart) March, however, brought that negative surprise with the IPCA rising 0.88% for the month, above market projections and defying the seasonal effect observed in recent years, which generally saw milder inflation for March. As a result, 12-month cumulative inflation accelerated from 3.81% to 4.14%, moving closer to the upper limit of the target band (4.50%). April seemed like a relief, but the deceptive kind—the envelope you open thinking you've got a new sticker, only to find a duplicate again. The IPCA varied by 0.67%, down from March's 0.88%, with the slowdown driven by gasoline and airfare prices. Over 12 months, however, the cumulative rate rose to 4.39%, ever closer to the target ceiling. The monthly figure improved, but the composition remained concerning.

The stickers that insist on repeating: not every duplicate sticker is the same (wait, what?), some are just persistent and others jam the whole album.
Food prices are the most annoying duplicate sticker in this collection. The benign scenario of 2025 for Brazilian dinner tables had an expiration date—and the market already knew it. But the speed of the turnaround was a surprise. Fresh produce was pressured by rains, milk and dairy products rose more than 4.0% in March, and meat prices were once again a highlight of the increase. Thus, these essential items led the hikes in the first four months, and the impact reached the shopping cart. As for administered prices (which have annual adjustments already calculated in advance), they arrived like those stickers no one expects, coming from outside the pack. The shock was external and rapid: the escalation of the conflict in the Middle East pushed oil prices up and contaminated fuel prices at the pump. Keep in mind that these deserve special attention, as the increase doesn't just stay on the same team's page. Its effect spreads throughout the entire album, driving up freight, food transport, logistics... A sticker that, on its own, ends up contaminating its neighbors.
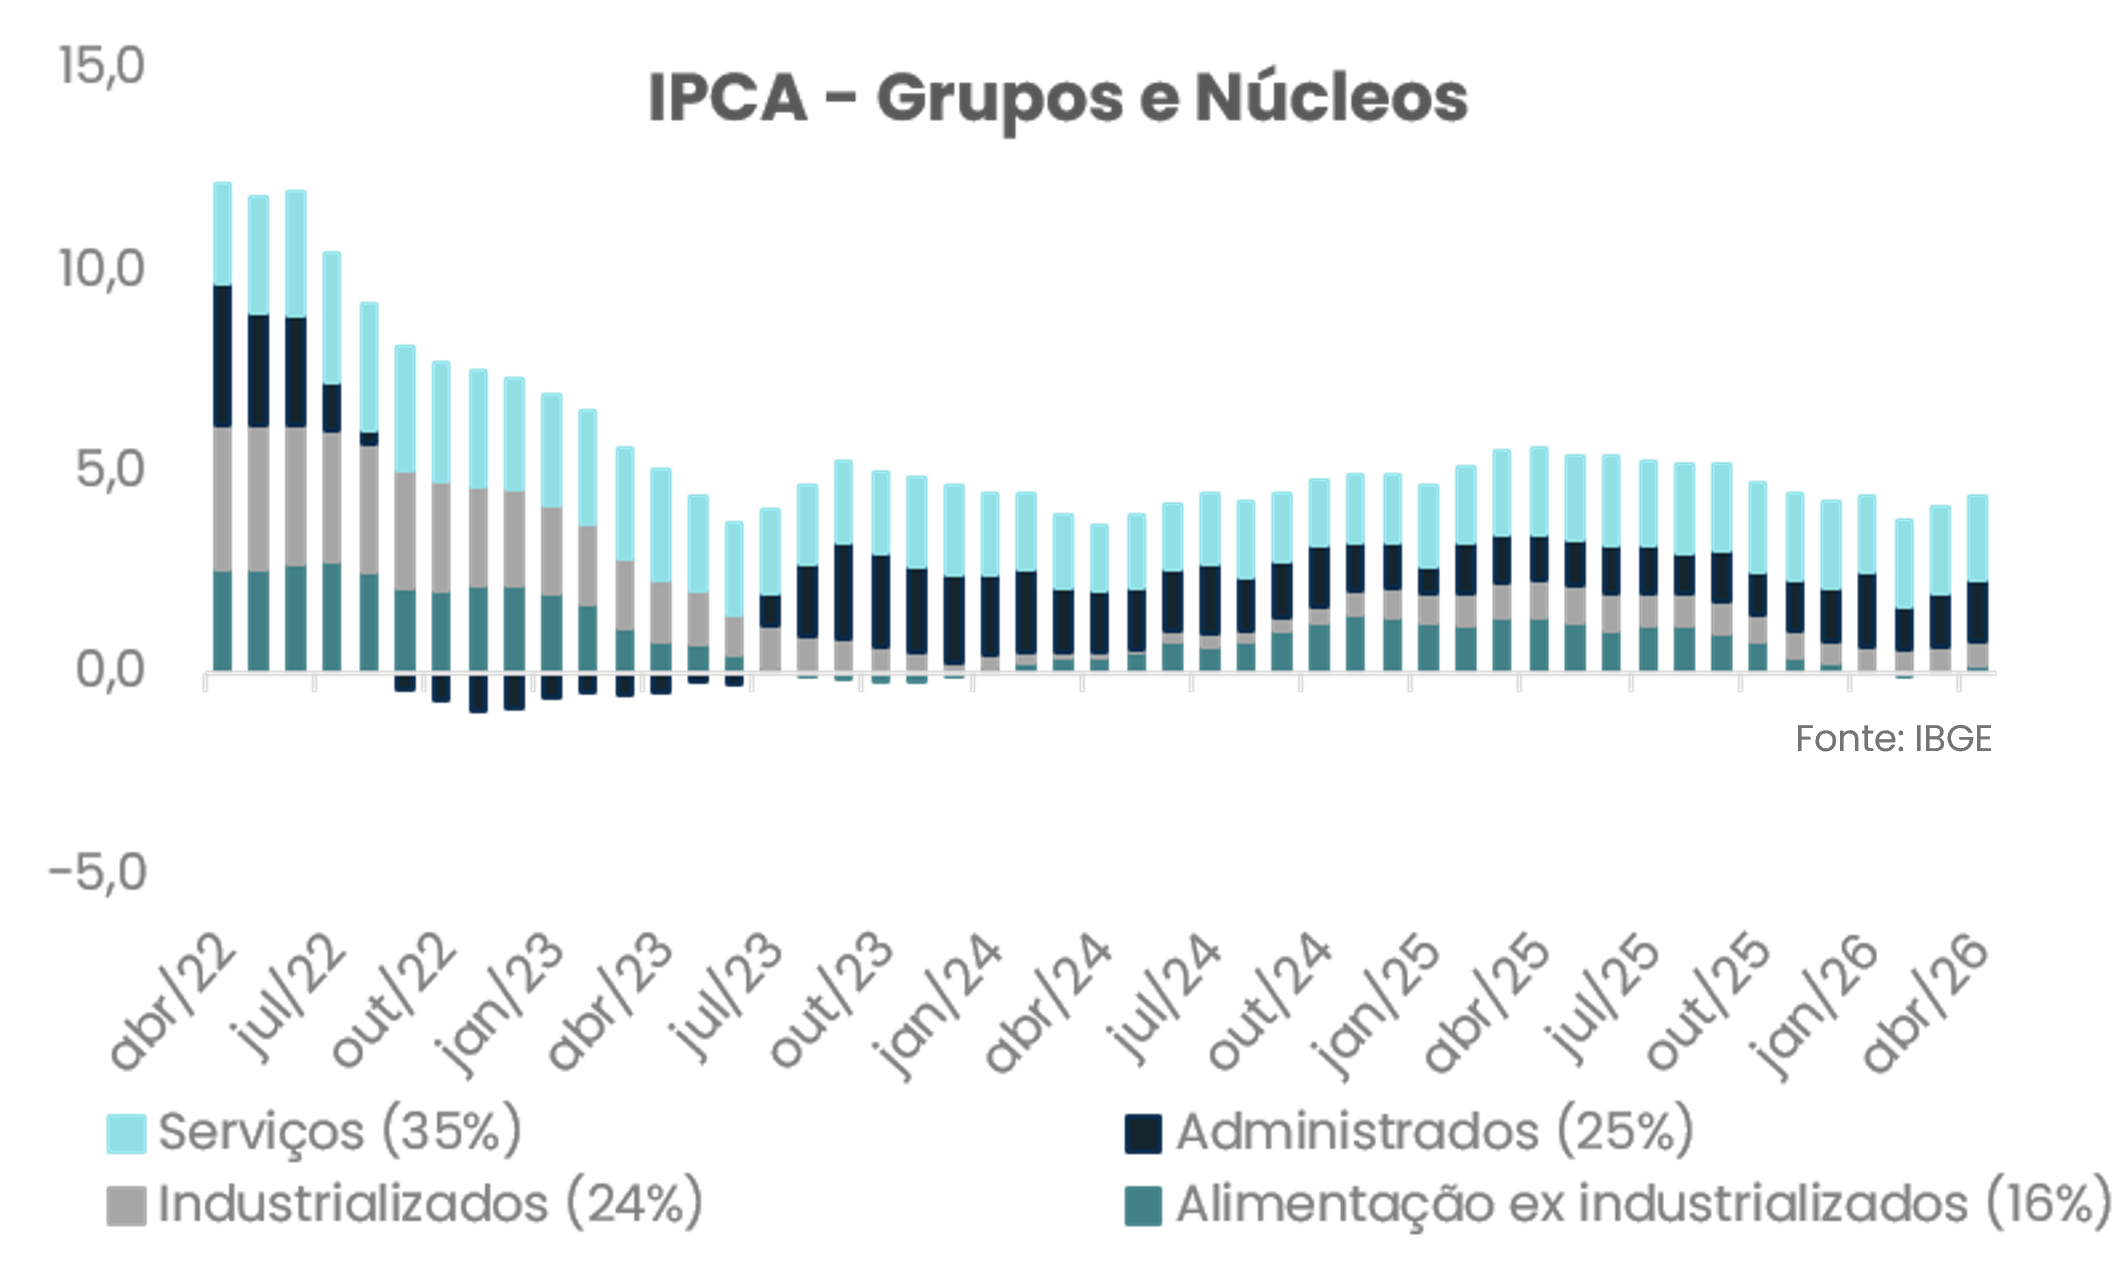
Last but not least, core measures and service prices are the trickiest types of stickers. Not because they are rare, but because they are persistent (hello, inertia!). Pressure in the services sector remains "intense and widespread," with a 12-month accumulated variation above 5.70%. It is worth remembering that services inflation carries inertial effects and is directly linked to a labor market that remains hot, in a cycle where higher wages drive up costs, which are passed on to prices, fueling new expectations for adjustments. Services are the most sensitive component of inflation for monetary policy, precisely because they tend to respond more persistently to heating demand and inflationary inertia—and disinflating this block requires more time and higher costs than any other group in the index. Core measures, when under pressure—as is the current case—show that inflation is not just a passing shock; it has substance, presence, and requires more time and cost to subside. (see chart).
Result: the market had to revise the collection. Those who put together their album in December with the stickers available in the Focus report projected an IPCA around 4.0%—within the target, without much room to spare, but within it. That envelope was reopened week after week. The projection for the 2026 IPCA rose for the tenth consecutive week in mid-May, crossing the target ceiling. In this week's Focus, the median for 2026 accelerated to 5.04%, the most significant increase in recent weeks. More than that, projections for 2027 and 2028 are also rising (see chart).

With inflation proving resilient, projections for our benchmark interest rate, the Selic, have also been recalibrated, and today the market expects a terminal rate of 13.25%, well above the 12.25% expected at the beginning of the year. Thus, the interest rate cut that would help the economy breathe a little easier has slowed down—and the sticker for more robust growth has ended up at the bottom of the envelope, mixed with a bit of uncertainty that could even surprise us. But that is a topic for another special.
There is still a long way to go before the album is complete. The tournament runs until July and the IPCA still has eight months ahead of it, meaning there is enough time for this script to change again, for better or worse. There are factors that could help assemble the collection with fewer bumps: the exchange rate has remained stronger than expected at the start of the year, oil prices could drop if the geopolitical landscape cools down, and the lagged effects of the high Selic rate have not yet finished doing their work. But what 2026 has already taught us is that completing the album is harder than it seemed. The shiny sticker—sustained convergence to the target—remains the most sought-after, the most expensive, and the rarest in the entire collection. And the championship, as we know, only ends when the referee blows the final whistle.

A summary of the main events of each day that may influence the exchange rate, all in less than 1 minute.
Listen nowThe Ouribank Group does not offer loans, credit or debit cards, and does not request or take responsibility for payments of bank slips or deposits into current accounts held by beneficiaries other than Ouribank S.A. Banco Múltiplo and Ouribank Group companies.
Be alert to any unusual practices for credit approval, such as advance payments. Be suspicious of emails that do not come from Ouribank, for example: @outlook, @gmail, @hotmail, etc., or messages via WhatsApp, Facebook, Instagram, and Telegram, or calls from third parties.
If you have any questions, please contact us at: 0800-771-4342 or (11) 4081-4444


Ouribank
CNPJ No. 78,632,767/0001-20 Ouribank Building
Av. Paulista, No. 1,728 - overstore, 1st, 2nd, 3rd, 4th, 5th, 7th and 11th floors
Bela Vista Zip Code - 01310-919
São Paulo - SP
Phone: (11) 4081-4444
Hearing Impaired Care:
(11) 3171-3003
P
Tamer Comunicação Empresarial
+ 5511 99602-1317
Gustavo Girotto
gugirotto@tamer.com.br
Ana Carolina Saito ana.saito@tamer.com.br

Social Media